Table of Contents
This post covers how I rebuilt my automated financial report as a web application. You enter a ticker, the app builds an 11-section fundamental analysis report in the browser, and you can download the same report as a PDF.
From PDF script to web app
A while ago I wrote a Python script that generates a PDF fundamental analysis report for any public company. I still used it regularly, but it had two limitations.
First, the data came from a paid API. The free tier was capped at 250 requests per day and only covered US companies. Second, the output was a local PDF: to analyze a company you had to have Python installed, clone the repository and run the script yourself.
I fixed the data problem first by switching the source to Yahoo Finance. It is free, needs no API key, and covers international tickers. It also exposes data the paid API did not give me on the free plan: analyst recommendations, price targets, earnings surprises, forward estimates, ownership and insider transactions.
Then I removed the "you need Python" problem by rewriting the whole pipeline as a web app in TypeScript with Next.js. The report now renders in the browser for anyone with the URL, and the PDF is still one click away.
What the report includes
Each report covers the last three or four fiscal years and is organized in 11 sections:
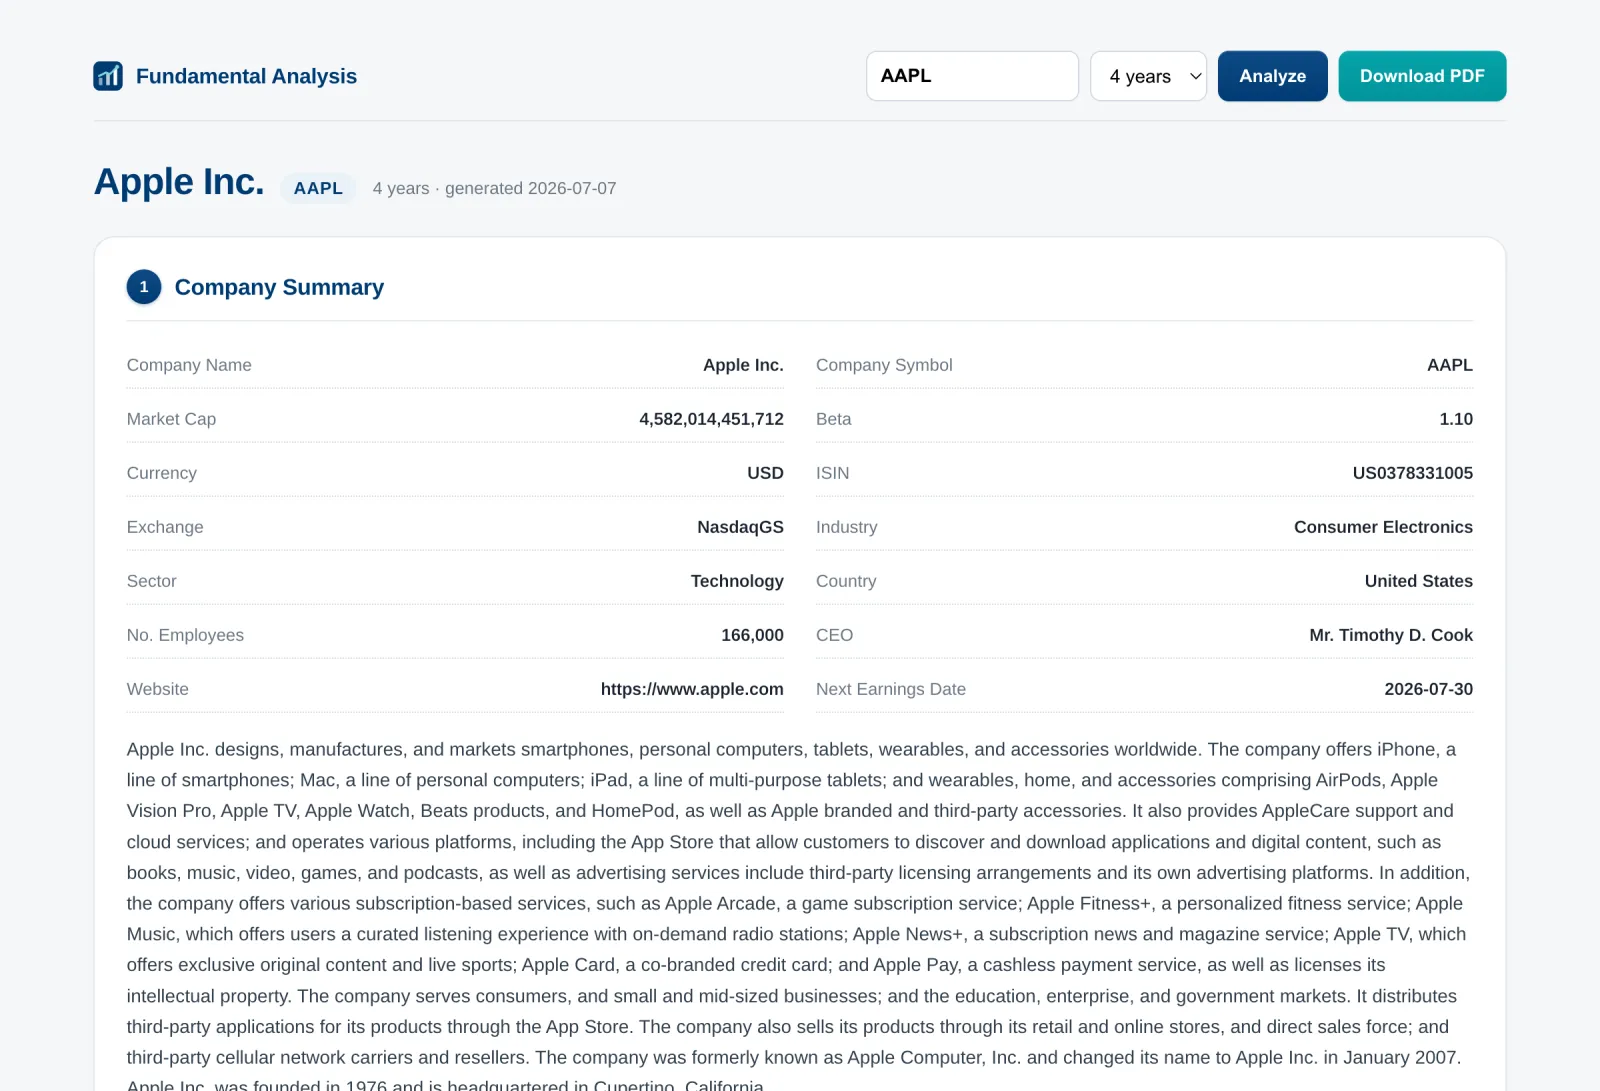
- Company summary: profile, business description, CEO, sector, next earnings date.
- Financial statements: income, balance sheet and cash flow, in nominal and common-size form.
- Risk and return ratios: debt, profitability and efficiency.
- Valuation: market ratios and key metrics, including the Graham Number and Net-Net value.
- Statement graphs for income, balance sheet and cash flow.
- Common-size graphs and equity uses.
- Dividend history, analyst recommendations and price targets.
- EPS estimates vs actuals and earnings surprises.
- Forward earnings and revenue estimates.
- Ownership breakdown: major and institutional holders.
- Insider purchases and recent insider transactions.
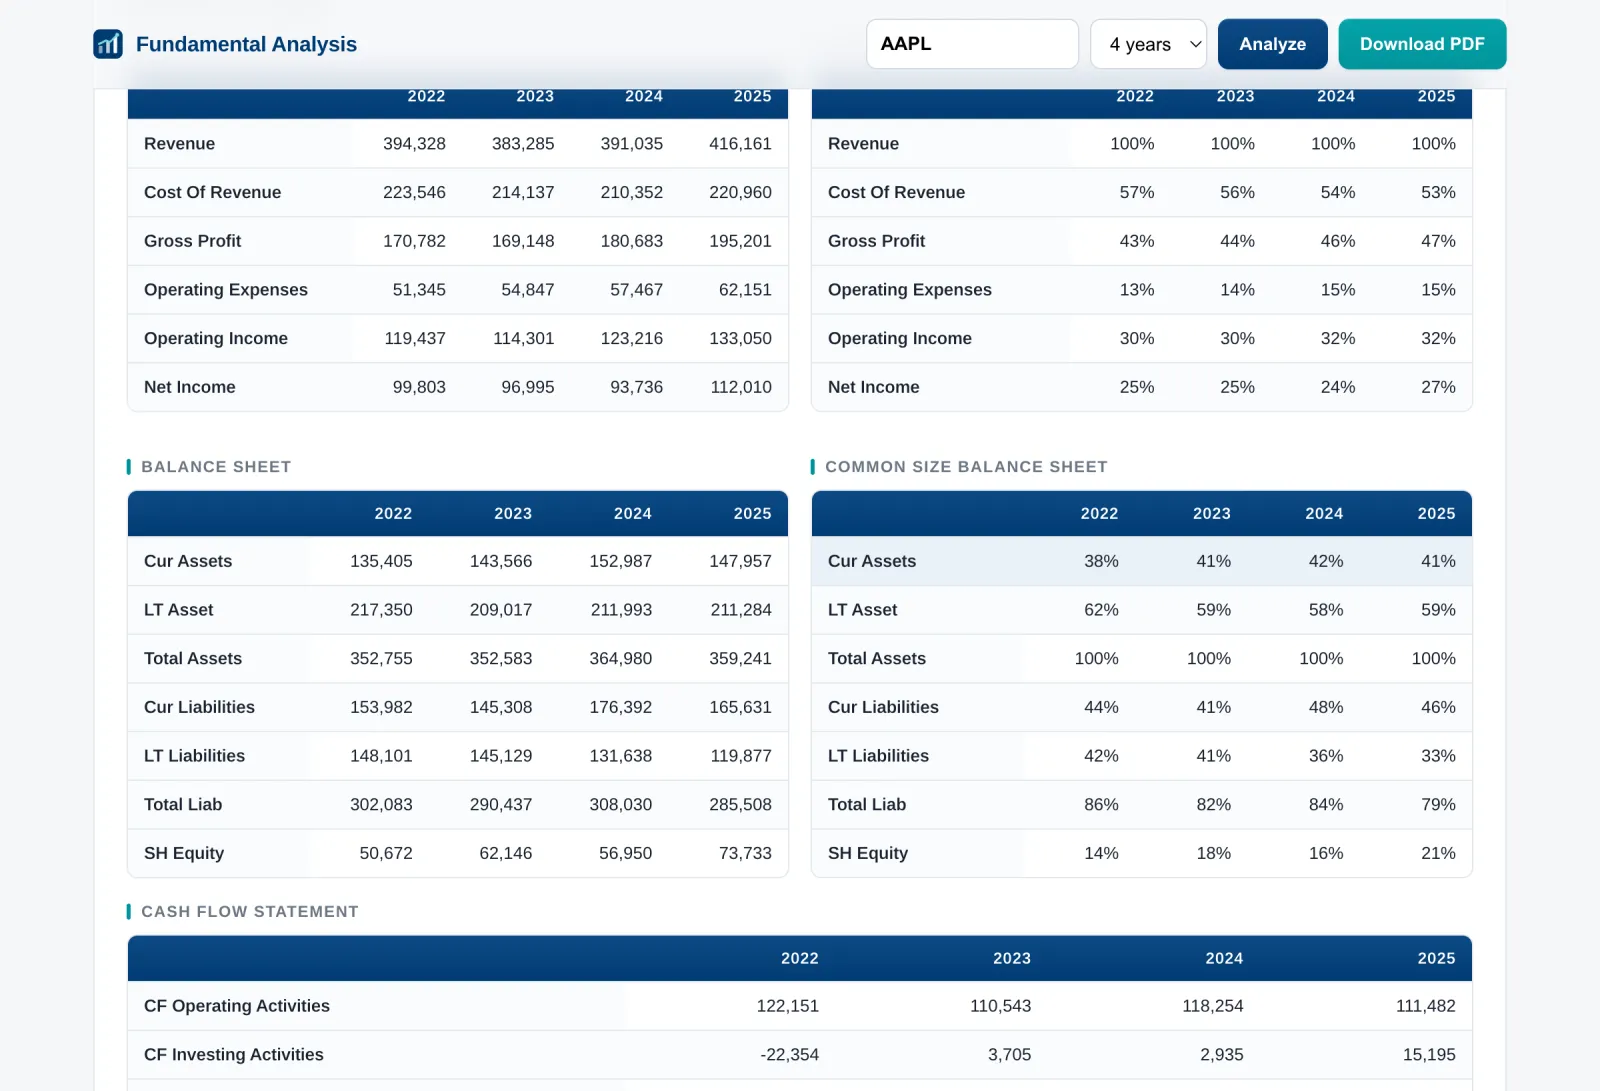
Financial statements, shown side by side in millions and as a percentage of revenue
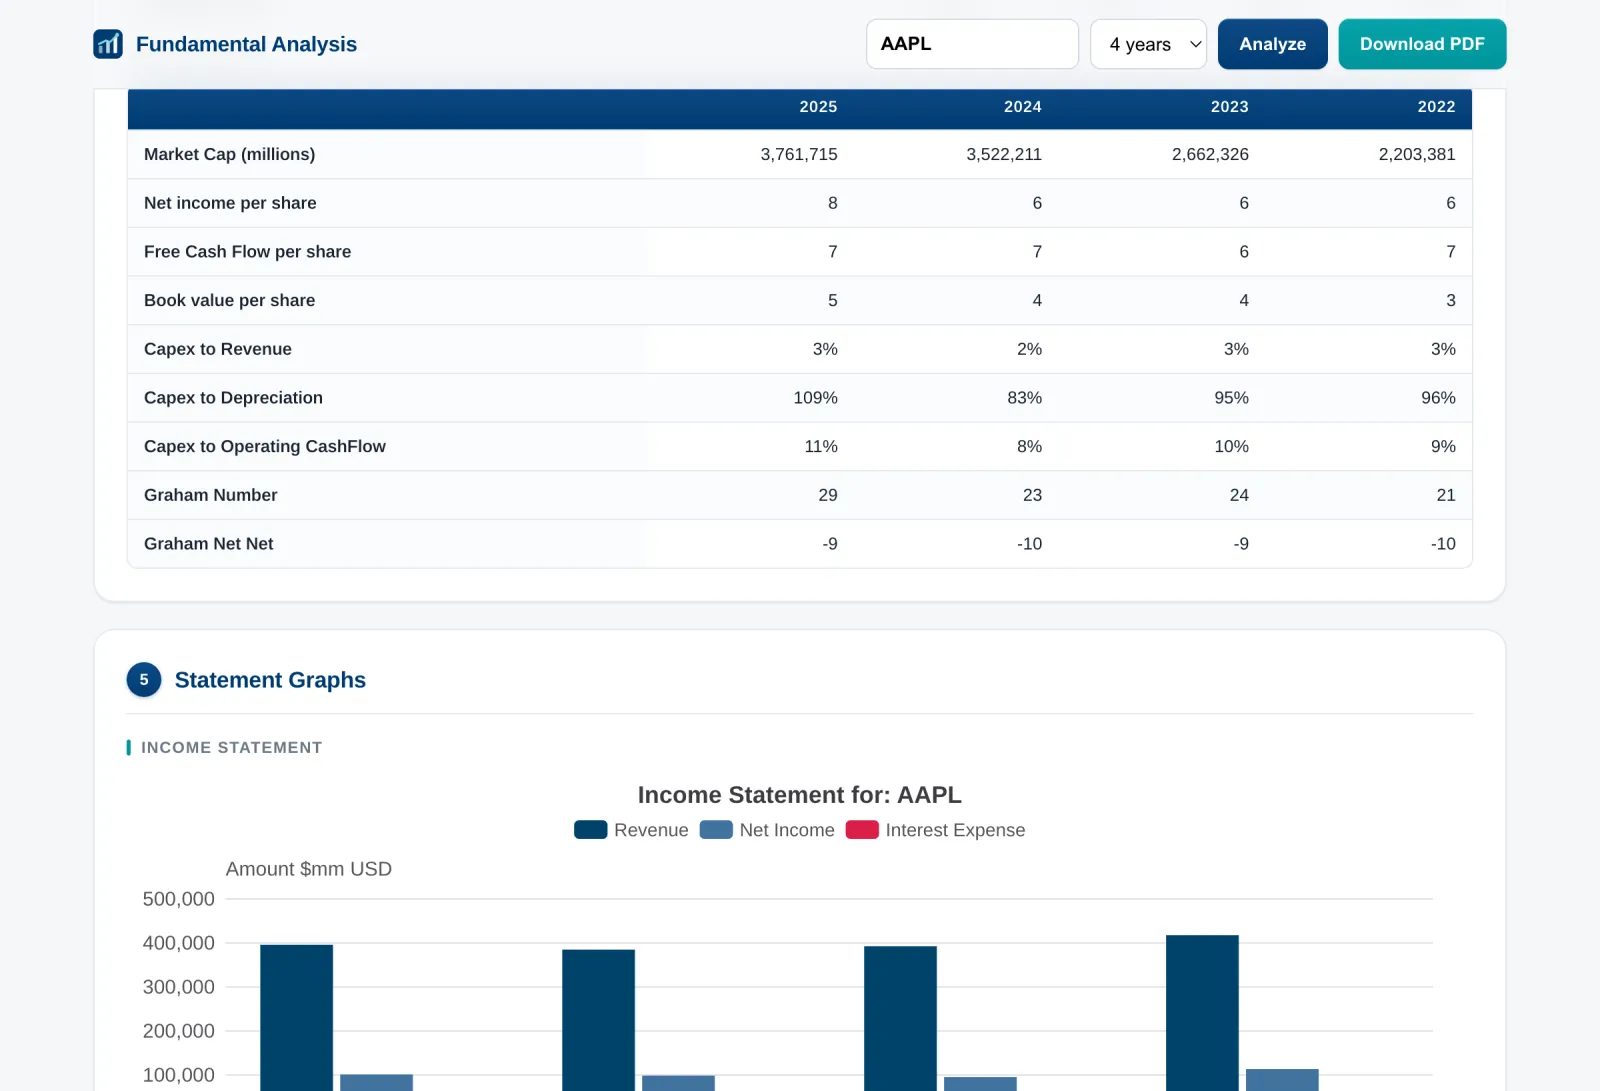
Market ratios and key metrics, including the Graham Number
The last five sections are new: the Python version only covered statements, ratios and charts. Analyst consensus, estimates, ownership and insider activity all come from Yahoo Finance modules that were not available to me before.
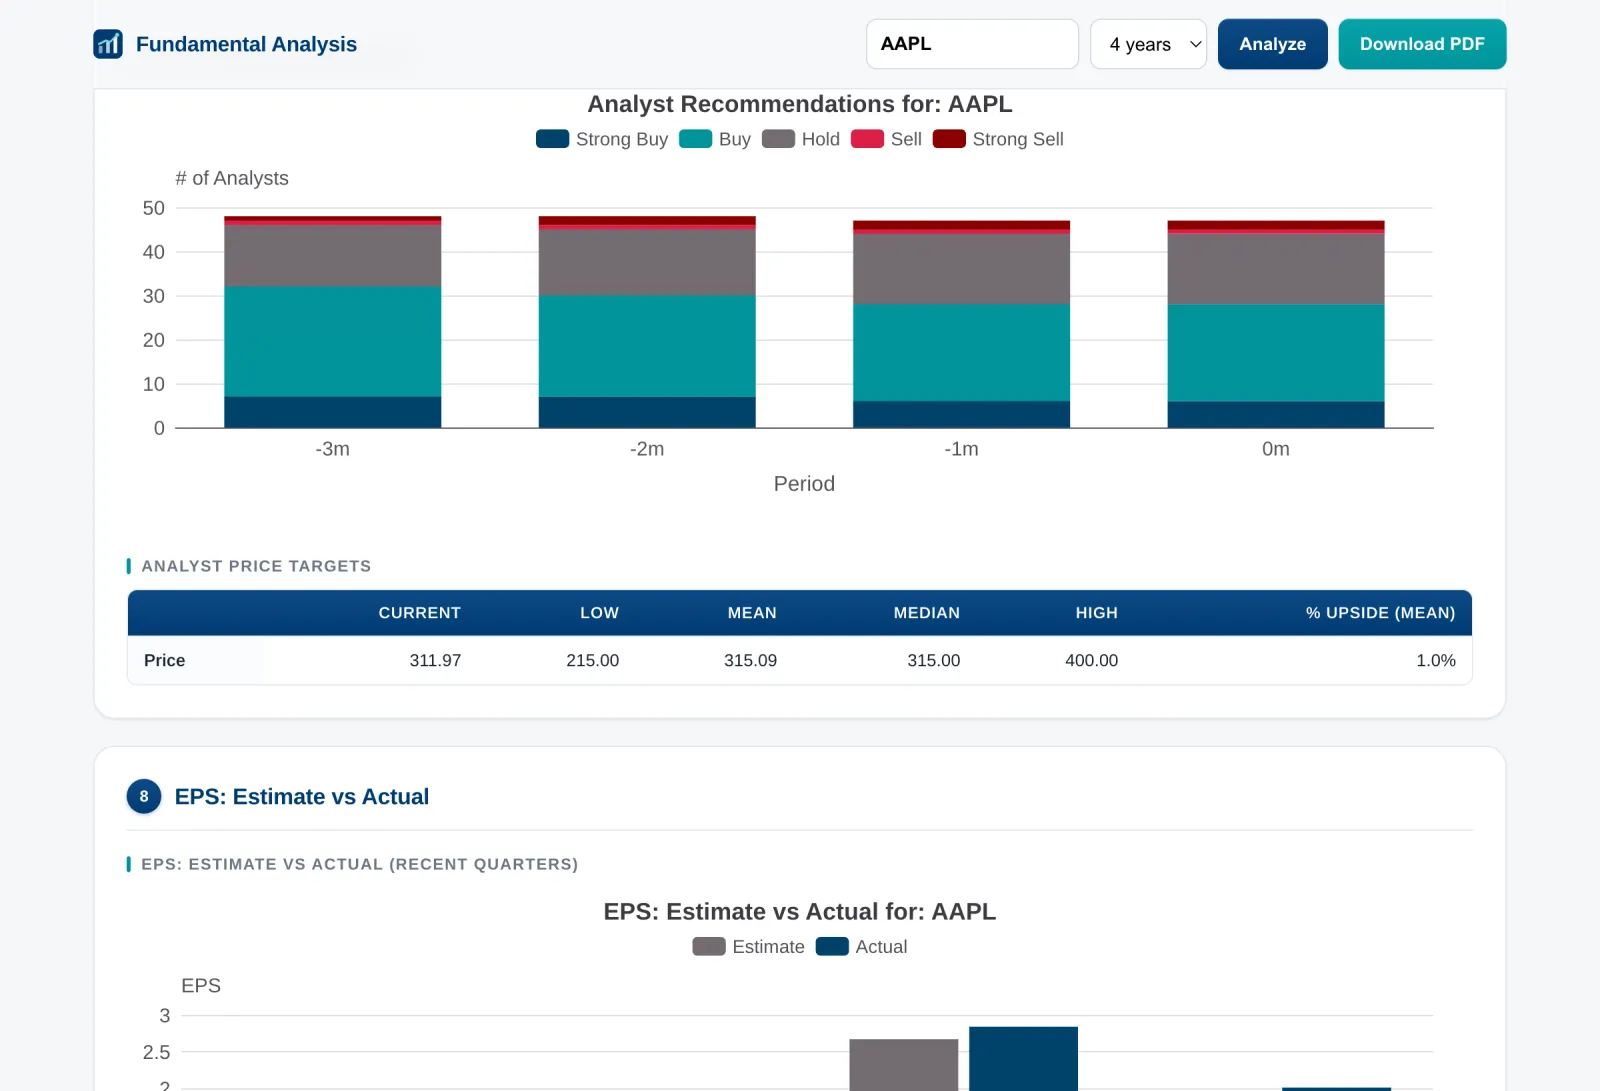
Analyst recommendations over the last months
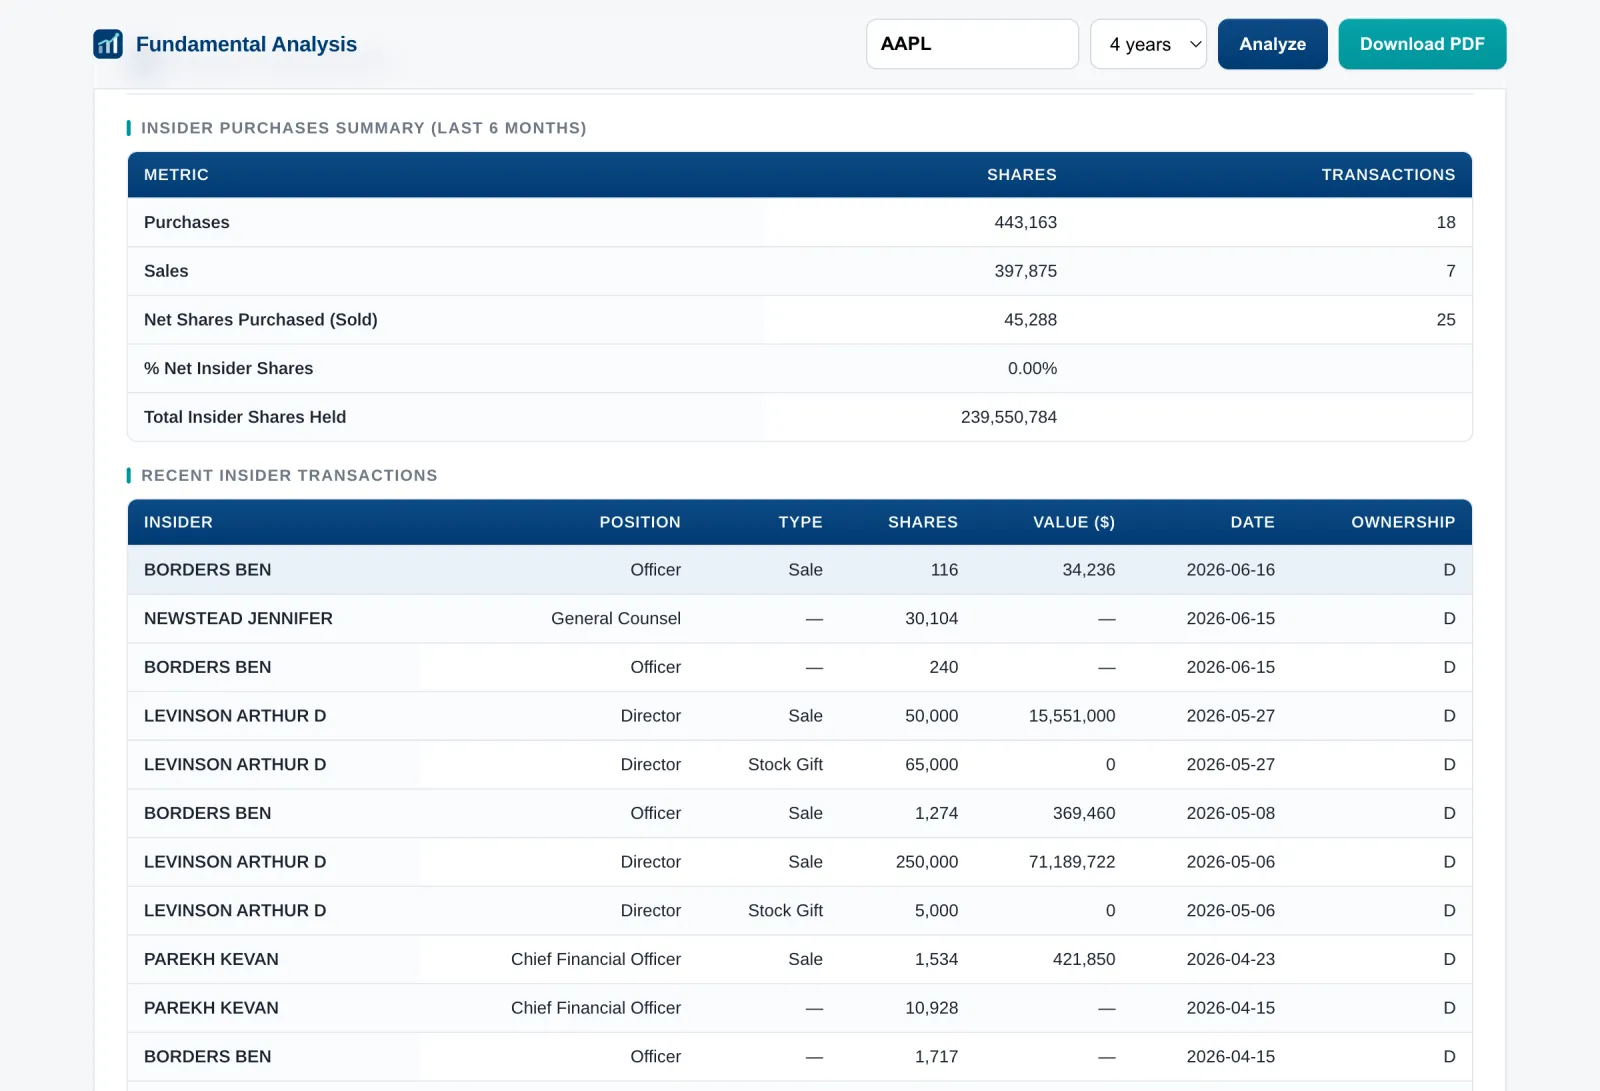
Insider purchases summary and recent insider transactions
One source of truth for web and PDF
The most important design decision was to make the web page and the PDF consume the exact same data. A single function, buildReport(ticker, years), orchestrates the whole pipeline: fetch the raw data, compute the ratios, trim to the requested years, and build every table and chart definition.
The interactive page calls it through a JSON endpoint and the PDF route calls the same function. There is no separate "PDF pipeline" that could drift out of sync: if a number appears on screen, the identical number appears in the PDF.
Every request is also stateless. Nothing is written to disk between requests, so the app can serve concurrent users without any coordination, which keeps hosting simple.
Fetching data from Yahoo Finance
The data layer uses yahoo-finance2, an open source Node.js client for the same endpoints the yfinance Python library uses. One report needs five requests: annual financial statements, a batch of quote-summary modules, daily price history, dividend history and an ISIN lookup. They all run in parallel.
Yahoo's data is unofficial, so individual pieces fail from time to time. Every request carries its own fallback: if the batched quote-summary call fails, the app retries the modules one by one so a single bad module does not sink the other twelve.
TypeScript
async function safeQuoteSummary(symbol: string, modules: string[]): Promise<Row> {
try {
return await yf.quoteSummary(symbol, { modules });
} catch {
// Fetch modules individually so one bad module doesn't sink the rest.
const out: Row = {};
for (const m of modules) {
try {
const r = await yf.quoteSummary(symbol, { modules: [m] });
Object.assign(out, r);
} catch {
/* tolerate missing module */
}
}
return out;
}
}
The same philosophy applies at render time. A company with no dividends, no analyst coverage or no insider records simply shows a dash or skips the chart. Missing data never turns into a failed report.
Computing the ratios
The report computes around 30 ratios across four groups: debt (current ratio, interest coverage, cash flow to debt), profitability (margins, ROE, ROIC, ROCE), efficiency (cash conversion cycle, turnover ratios) and market ratios (P/E, P/B, EV multiple, dividend yield).
This module is a line-for-line port of the Python version, so I could verify every value against reports the old script had already produced. Divisions go through a safeDiv() helper that returns null instead of infinity when a denominator is zero or missing, and derived values have fallback chains: free cash flow uses the reported figure when Yahoo provides it, otherwise operating cash flow minus capital expenditures.
My favorite metrics in the valuation section are the two Benjamin Graham numbers:
TypeScript
const eps = safeDiv(r.netIncome, sharesYear[i]);
const bvps = safeDiv(b.totalStockholdersEquity, sharesYear[i]);
// Graham Number: fair value estimate for a defensive investor.
let grahamNumber: Num = null;
if (eps != null && bvps != null && eps > 0 && bvps > 0) {
grahamNumber = Math.sqrt(22.5 * eps * bvps);
}
// Net-Net: current assets minus all liabilities, per share.
const netNetNum =
b.totalCurrentAssets == null || b.totalLiabilities == null
? null
: b.totalCurrentAssets - b.totalLiabilities;
const grahamNetNet = safeDiv(netNetNum, sharesYear[i]);
Writing charts once, rendering them twice
The charts are built with Apache ECharts. Each chart builder is a pure function that returns a plain option object; it knows nothing about where the chart will be drawn.
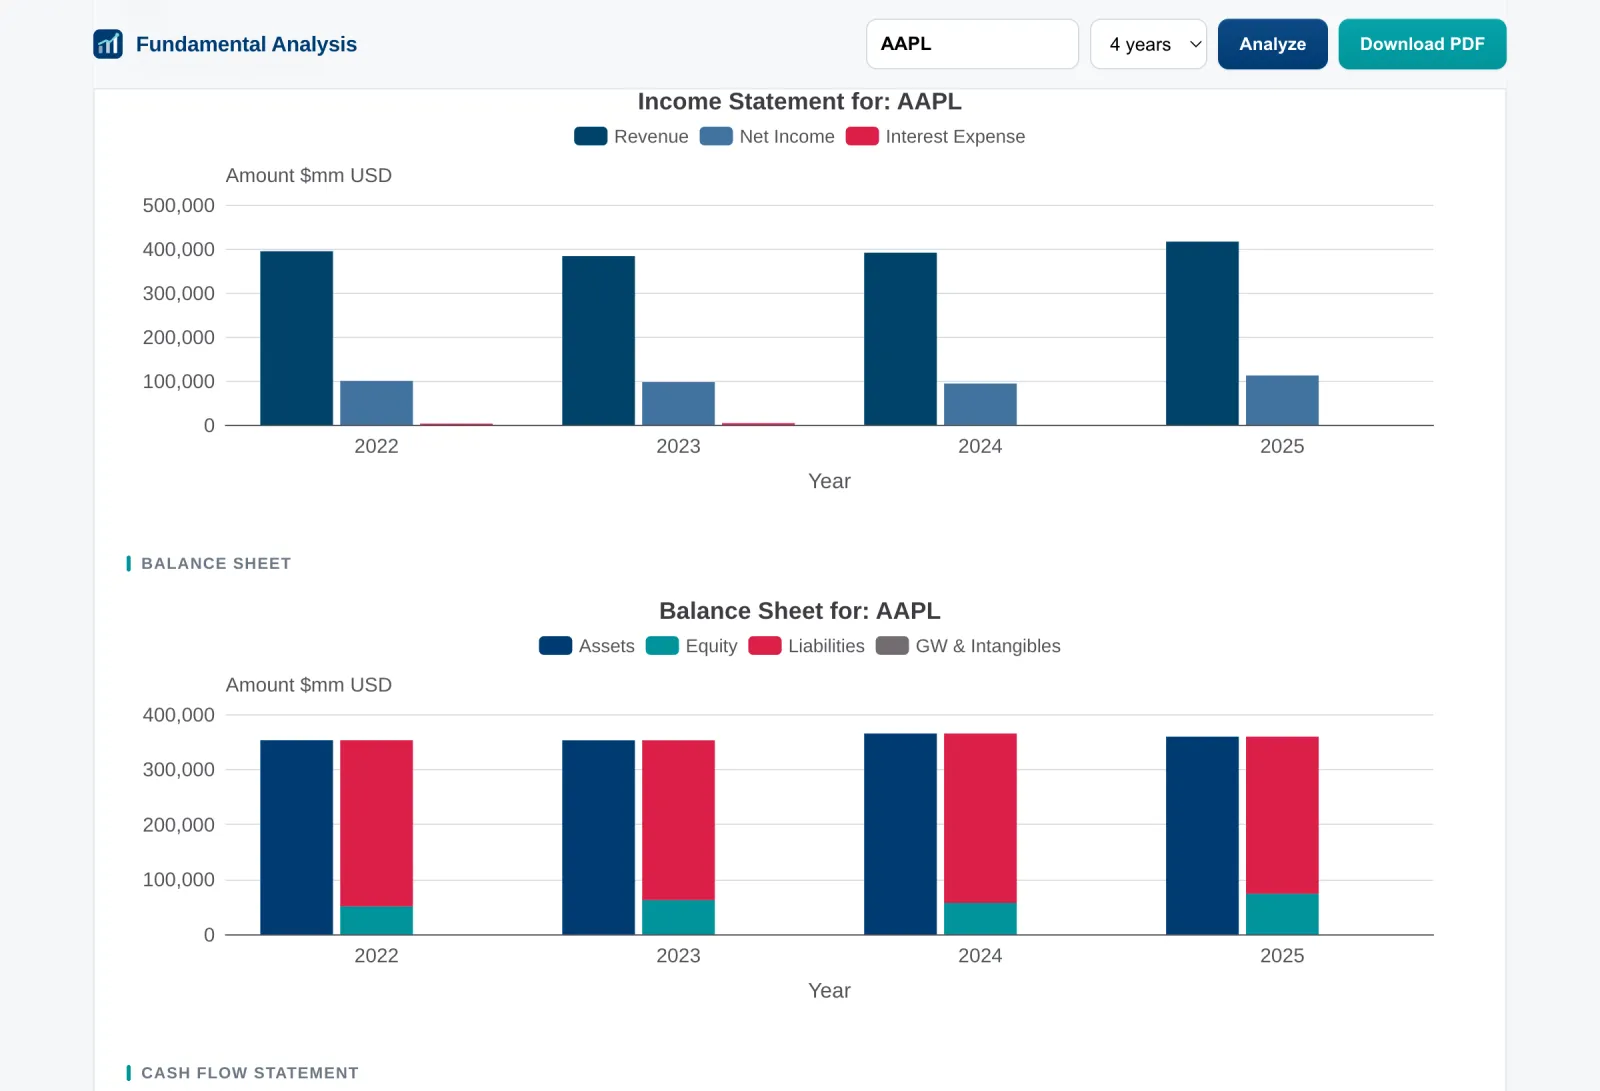
Statement graphs: the same option objects power the browser and the PDF
In the browser, the option objects go straight into echarts-for-react. For the PDF the interesting part is rendering them without a browser: ECharts can run headless on the server and emit an SVG string, and resvg rasterizes that SVG into a PNG. No Puppeteer, no Chromium in the deployment image.
TypeScript
export async function chartToPng(option: ChartOption, width = 800, height = 400) {
// 1. ECharts headless SSR -> SVG string
const chart = echarts.init(null, null, { renderer: "svg", ssr: true, width, height });
chart.setOption(option);
const svg = chart.renderToSVGString();
chart.dispose();
// 2. resvg rasterizes the SVG with bundled fonts -> PNG
const resvg = new Resvg(svg, {
font: {
fontFiles: FONT_FILES, // Arimo Regular + Bold, shipped with the app
loadSystemFonts: false, // deterministic across environments
defaultFontFamily: "Arimo",
sansSerifFamily: "Arimo",
},
fitTo: { mode: "width", value: width * 2 }, // 2x raster for crisp PDF text
});
const png = resvg.render().asPng();
return `data:image/png;base64,${Buffer.from(png).toString("base64")}`;
}
The font settings matter more than they look. Loading system fonts made chart labels render as empty "tofu" boxes on the server, so the app ships its own copy of Arimo and never falls back to the system path. Arimo is metric-compatible with Helvetica, which is what the PDF body uses, so chart text and document text match.
Caching and rate limits
Yahoo Finance has no official API, so being polite about request volume is part of the design. Reports are cached for ten minutes, keyed by ticker, years and calendar day. A page load followed by a PDF download hits Yahoo once, not twice.
One detail worth copying: the cache stores the promise, not the finished result. If two users request the same ticker at the same time, the second request joins the first fetch instead of firing a duplicate. Failures delete the cache entry so an error is never served for ten minutes.
TypeScript
const TTL_MS = 10 * 60 * 1000;
const cache = new Map<string, { at: number; promise: Promise<Report> }>();
export function buildReport(ticker: string, years: number): Promise<Report> {
const key = `${ticker.toUpperCase()}:${years}:${new Date().toISOString().slice(0, 10)}`;
const hit = cache.get(key);
if (hit && Date.now() - hit.at < TTL_MS) return hit.promise;
const promise = build(ticker, years).catch((e) => {
cache.delete(key); // don't cache failures
throw e;
});
cache.set(key, { at: Date.now(), promise });
return promise;
}
Generating the PDF
The PDF layout is built with react-pdf, which lets me describe the document as React components: the same mental model as the web page, with pages instead of sections. The document mirrors all 11 sections and comes out at around 12 pages.
Since the tables and chart images come from the shared report object, the PDF is a faithful print version of what is on screen: same values, same charts, same fonts.
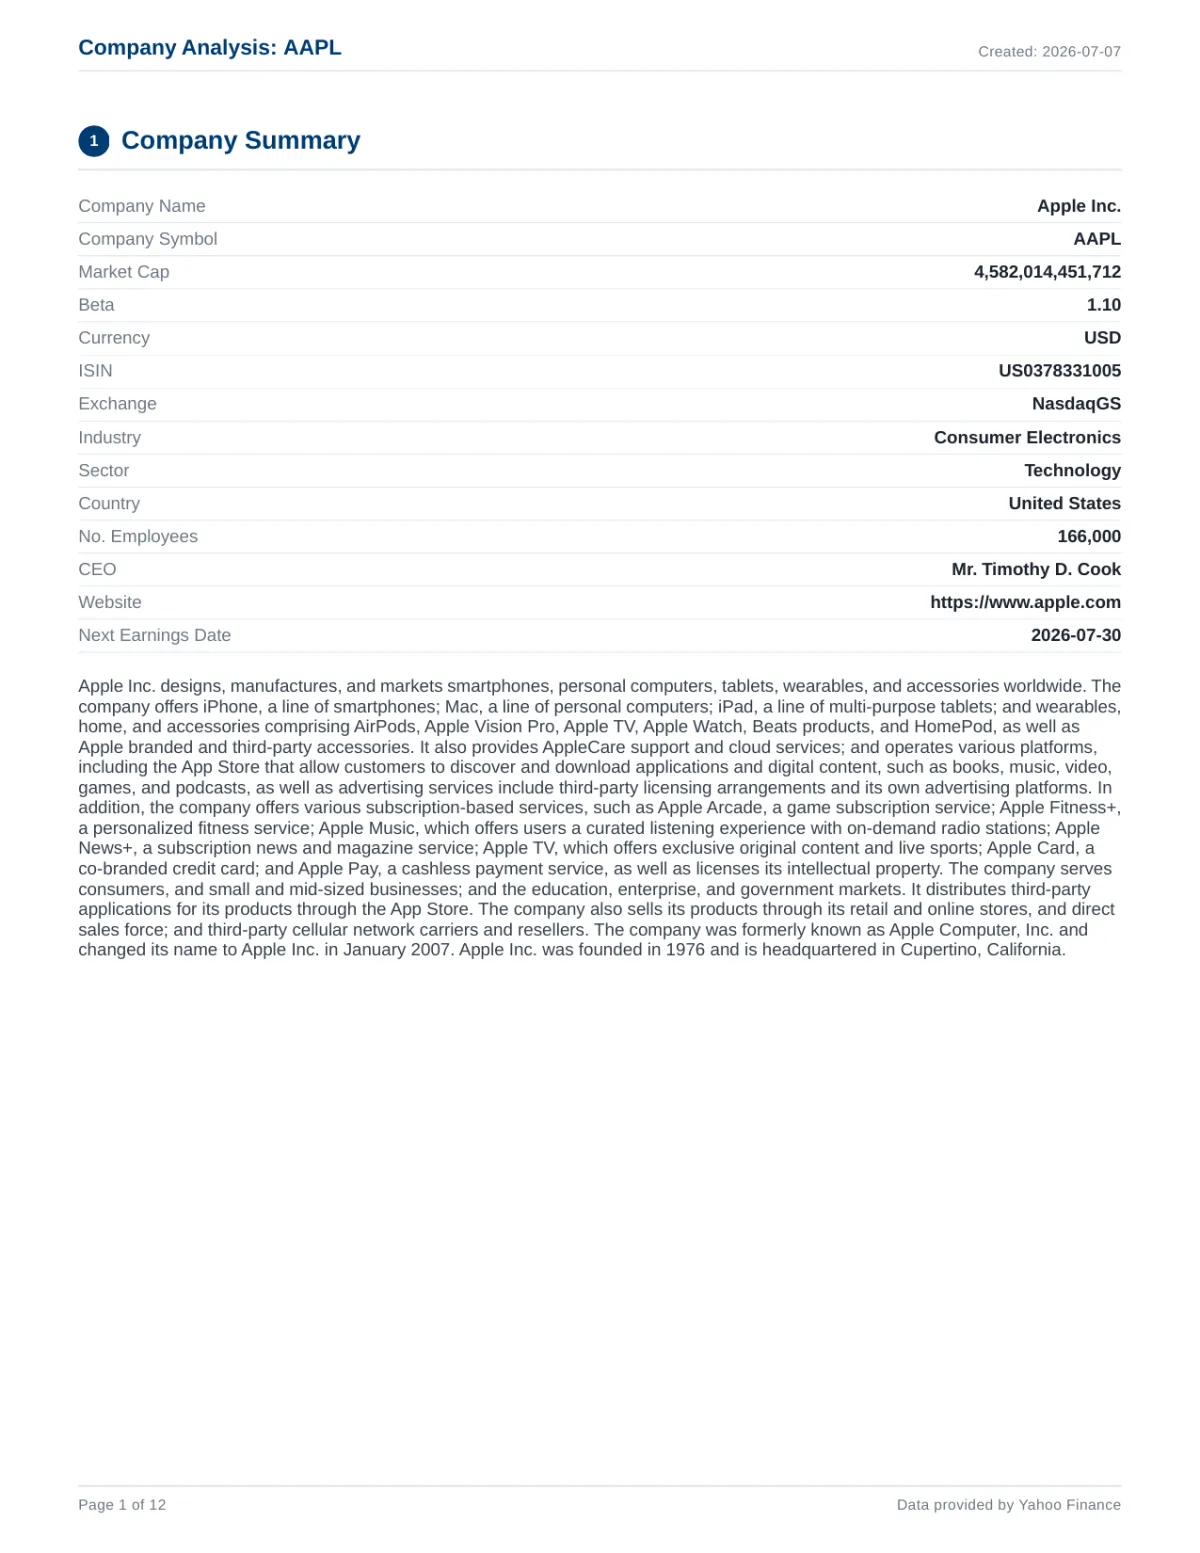
First page of the PDF report for Apple
Try it yourself
The app is deployed at stock-fundamentals.pablocruz.io. Type a ticker or pick one of the examples, choose three or four years, and press Analyze. Yahoo's annual statements only reliably go back about four years, which is why the selector stops there.
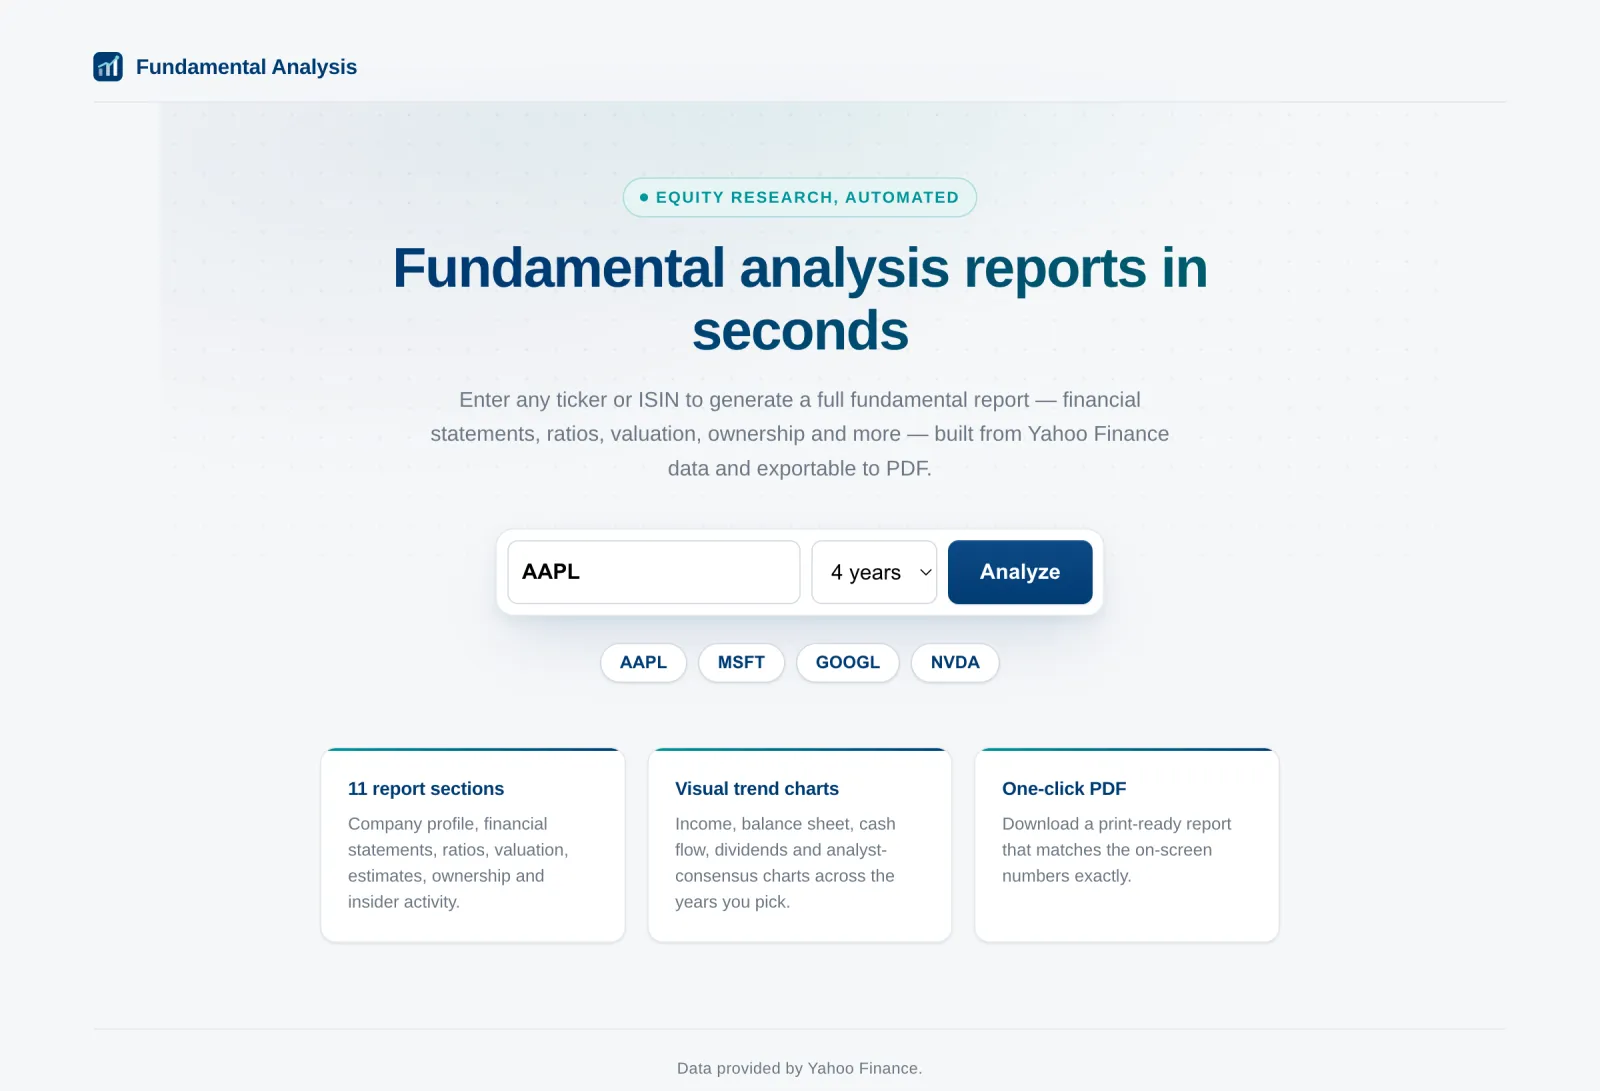
The landing page: enter a ticker or ISIN and press Analyze
The report is also available directly through the API:
Bash
# Full report as JSON
curl "https://stock-fundamentals.pablocruz.io/api/report?ticker=AAPL&years=4"
# Same report as a PDF
curl -o aapl.pdf "https://stock-fundamentals.pablocruz.io/api/report/pdf?ticker=AAPL&years=4"
Final thoughts
Porting a working Python pipeline to TypeScript was less risky than it sounds: the old script served as an executable specification, and I could compare every table against reports it had already generated.
There is still room to grow: quarterly analysis, peer comparison against sector averages, and a proper job queue if traffic ever gets heavy for Yahoo's unofficial endpoints.
As with the original project, remember that fundamental analysis is only one part of a stock selection process. Use the report to understand a company, not as a buy signal.
You can check out my other projects here.
Pablo.
Get in touch!
I'm currently open to work and I'd be happy to chat.
Feel free to reach out if you are interested in what I can bring
to your project or team.